Radar DataTree: Transforming thousands of scans into a single cohesive model

Data Scientist
From structure to scale, radar needs a model that organizes complete collections as time-aware, cloud-native datasets.
In our second post, we looked at how new standards and open-source tools are transforming weather radar from raw binary blobs into structured, metadata-rich datasets. FM-301—an official data model adopted by the World Meteorological Organization (WMO)—describes how radar scans should be stored and annotated for long-term use. And Xradar, a Python library developed by the open radar science community, brings that standard to life—loading Level II files into analysis-ready xarray objects that preserve sweep geometry, variable metadata, and geolocation.
That’s a huge leap forward. But for many use cases, it still isn’t enough.
Even when each radar scan is structured correctly, the broader workflow remains fragmented. Each file captures a single Volume Coverage Pattern (VCP)—a 3D snapshot in time—but scientific analysis rarely stops there. Researchers, modelers, and operational teams often need to analyze hundreds or thousands of consecutive VCPs: tracking storms over time, extracting vertical profiles, training machine learning models, or constructing climatologies. And yet, every one of those scans still lives in its own file, requiring separate decoding, alignment, and I/O.
Radar is inherently temporal, yet data infrastructure still treats time as an afterthought.
This fragmentation adds complexity and cost to every downstream workflow. It forces users to rebuild metadata context across files, handle inconsistent sweep counts, and manage large-scale analysis through custom code. Even with FM-301-compliant Zarr files, there’s no built-in notion of a radar “dataset” that spans time—only a collection of isolated, structured volumes.
At Earthmover, we see this challenge as not just a radar problem, but a lack-of-structure problem in how radar data is stored and accessed. Radar is a high-resolution, high-frequency sensor system that produces complex array data—exactly the kind of scientific signal our platform is designed to support. That’s why we’ve been developing a model that brings radar into the modern data stack: one that’s cloud-native, time-aware, scalable, and maintainable over the long term.
In this post, we introduce the Radar DataTree: a new data model that organizes full radar collections—not just single scans—into coherent, temporal, analysis-ready datasets. Built with xarray-datatree and exportable to Zarr, the Radar DataTree enables scalable workflows, reproducible science, and version-controlled storage. When combined with Icechunk—an open-source transactional storage engine for Zarr—the model supports updates and data versioning, ensuring safe, collaborative use in cloud environments.
The result is a radar archive that behaves more like a database: scalable, updatable, and ready for analysis at any point in time.
Introducing the Radar DataTree Model
To truly scale radar science, we need a model that organizes radar observations not just as files—but as datasets. That’s the motivation behind the Radar DataTree: a hierarchical data structure that treats an entire radar collection as a single, navigable, time-aware object.
It starts with raw radar files stored in the cloud—millions of them—each representing a single VCP at a given timestamp. Using an Extraction, Transformation, and Loading (ETL) process, we load and decode these files with Xradar, organizing them into an Xarray DataTree object where each node corresponds to a specific VCP and preserves its full FM-301 structure—including sweep geometry, coordinate variables, and standardized naming conventions defined by the WMO.
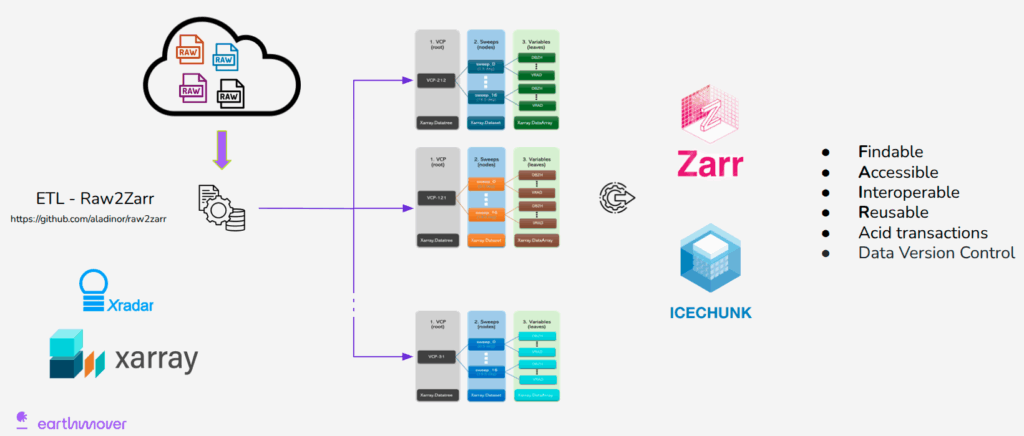
The Radar DataTree model. Individual radar scans (VCPs), stored in cloud buckets, are decoded using Xradar and organized into a hierarchical xarray-datatree, preserving sweep structure and metadata. The resulting tree is exported to Zarr and managed with Icechunk as a time-aware, versioned dataset—supporting ACID-compliant updates, scalable analysis, and FAIR, cloud-native workflows.
Within each VCP node, scans are aligned and concatenated along the time dimension, enabling fully navigable time series for each scan pattern. Once structured in this way, the dataset is exported to Zarr and managed with Icechunk, enabling versioned, ACID-compliant updates—turning radar archives into FAIR-compliant, queryable, cloud-native datasets.
This structure solves a core radar pain point: instead of loading and decoding scans one at a time, researchers can now load full time series, subset them by variable, and compute analyses directly—without breaking context or flattening metadata.
At Earthmover, we use this model to build cloud-hosted radar datasets that are not only efficient to query—but analysis-ready, metadata-rich, and versioned for collaborative use.
In the next section, we’ll explore one such dataset from the KVNX radar site in Oklahoma, and show how the Radar DataTree performs in practice.
Exploring a Month of Radar Data
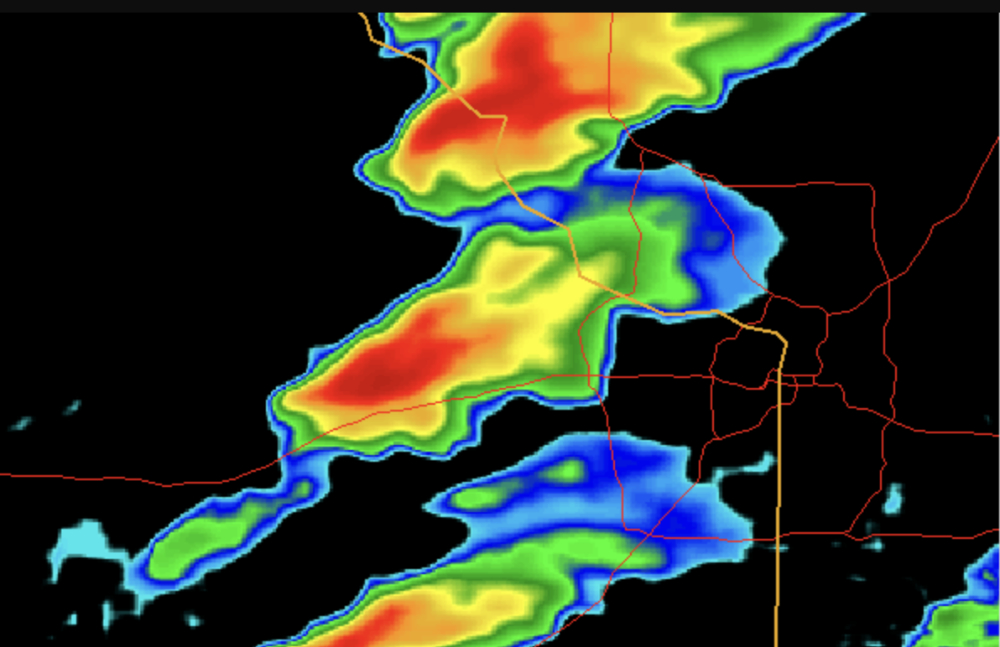
To see the Radar DataTree in action, let’s start with a real-world example: one month of radar data from the KVNX radar site during May 2011 — a period that included several severe weather outbreaks. In traditional workflows, this dataset would mean over 6,000 individual files, stored in different folders, requiring manual decoding, parsing, and alignment.
With the Radar DataTree, we open it all at once — as a single, coherent dataset.
In just one step, we load the entire month from cloud storage. Under the hood, this includes multiple Volume Coverage Patterns (VCP-11, VCP-12, VCP-212, and others), each containing hundreds of time-stamped radar scans. Instead of scattered files, we now have a hierarchical structure, where each VCP is a node, each sweep is a group, and each measurement (like reflectivity or velocity) is a variable — all navigable like folders.
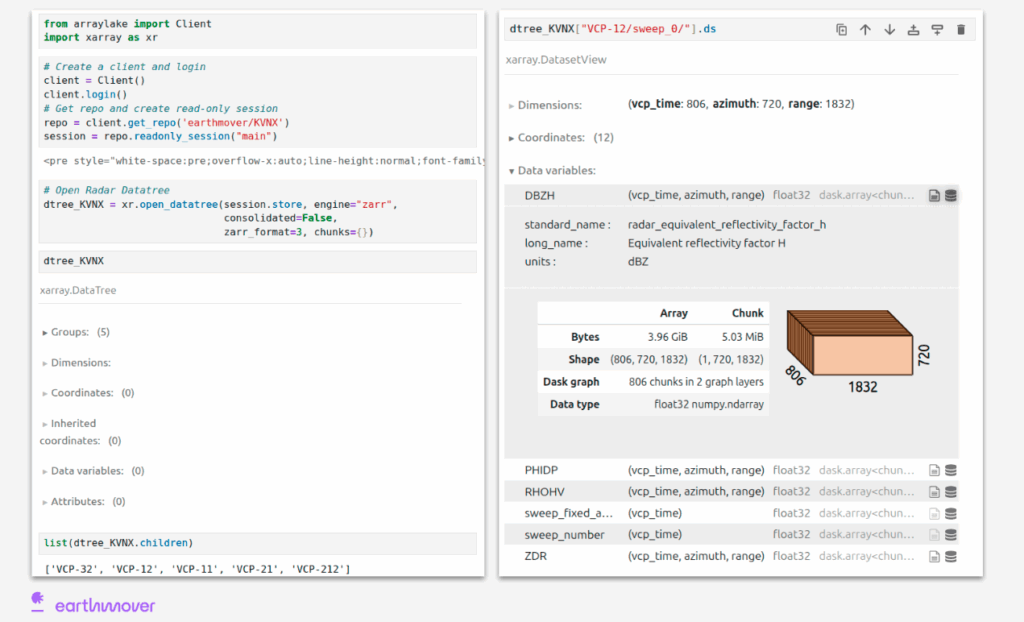
Radar DataTree in action. Radar dataset from the May 2011 KVNX archive, structured using the Radar DataTree model. Each node represents a full volume scan (VCP), with nested sweeps and CF-compliant radar variables. The dataset spans five VCP types and thousands of scans—unified into a single, time-aware, analysis-ready object.
You can think of it like navigating a well-organized filesystem. Want to access reflectivity from the lowest sweep of a storm-mode scan? Just use a path like “/VCP-212/sweep_0/DBZH” — no filename parsing, no decoding functions, no lookup tables.
This structure is analysis-ready by design. Every node in the tree behaves like a regular xarray.Dataset or DataArray, preserving its FM-301 structure and metadata. That means researchers can filter, slice, and visualize the data directly — with support for lazy loading, chunked access, and parallel computation thanks to Zarr and Dask.
From Structure to Science: QVPs and QPE at Scale
Once radar data is structured and time-aware, analysis workflows that used to take hours can now be performed in seconds — without writing custom ETL pipelines or managing temporary files.
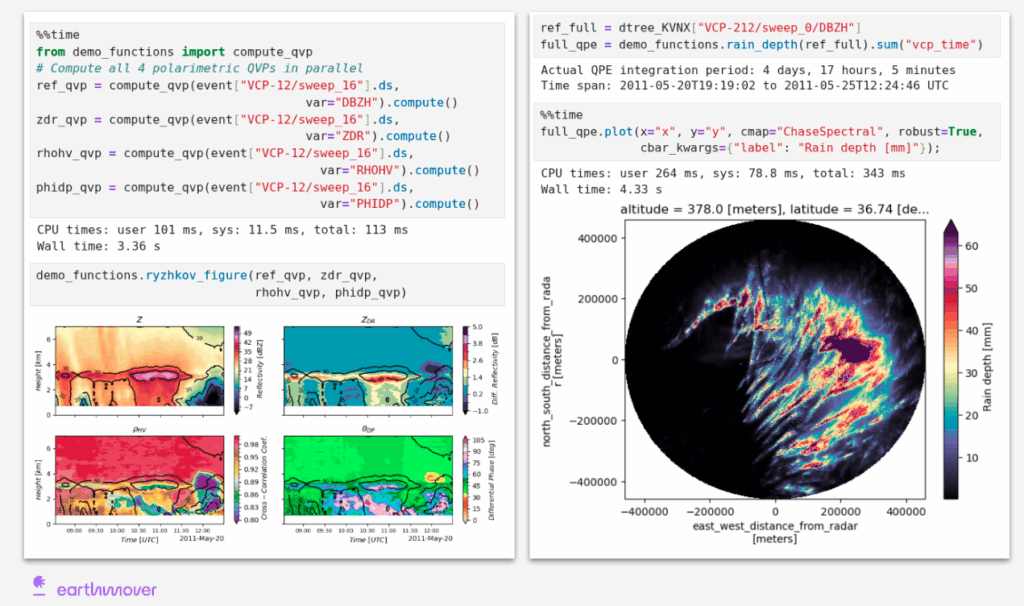
Two examples show what’s possible when radar data becomes structured, time-aware, and cloud-native: Quasi-Vertical Profiles (QVPs; Ryzhkov et al., 2016) and Quantitative Precipitation Estimation (QPE; Marshall & Palmer., 1948). QVPs reveal vertical storm structure by azimuthally averaging radar variables across sweeps. In our case study, we computed four polarimetric QVPs from 42 radar scans in just 3.4 seconds, processing over 800,000 data points in parallel using Dask—with no local files or preprocessing required. The resulting 4-panel visualization shows storm intensity (DBZH), particle shape (ZDR), diversity and homogeneity (ρhv), and concentration (ΦDP) evolving over time.
Rapid QVP and QPE analysis from a cloud-hosted Radar DataTree.
Left: Quasi-Vertical Profiles (QVPs) of four polarimetric variables—reflectivity (Z), differential reflectivity (ZDR), correlation coefficient (ρhv), and differential phase (ΦDP)—computed in 3.36 seconds across 42 radar scans. Right: Quantitative Precipitation Estimation (QPE) over a 4-day period, visualized as accumulated rain depth, computed in 4.33 seconds. Both workflows run in parallel on cloud-native data using Dask, with no local downloads or file decoding.
Using the same dataset, we also computed precipitation accumulation across the full May 2011 archive—over 416 radar volumes. With the Radar DataTree model, this QPE workflow took just 4.3 seconds, producing a high-resolution map of total rainfall for hydrology, validation, or climate studies. Both analyses ran directly from cloud storage, demonstrating how structured radar datasets reduce hours of processing to seconds of science.
From Fragmented Files to Scalable Science
The Radar DataTree represents more than just a new data structure—it’s a shift in how radar data can be used. By combining WMO-standard FM-301 structure, xarray-datatree hierarchy, Zarr chunked storage, and Icechunk’s transactional updates, we’ve built a model that turns thousands of fragmented files into a single, analysis-ready, versioned dataset.
This unlocks workflows that were previously slow, manual, or brittle—enabling scientists to focus on the science instead of decoding formats or managing I/O. Whether it’s tracking storm evolution with QVPs or generating long-term precipitation maps, the DataTree makes radar data truly FAIR, scalable, and reproducible.
To explore this workflow in more depth:
- Try the full demo notebook on GitHub: earth-mover/radar-data-demo
- Watch the Earthmover Radar DataTree demo recording (Aug 14, 2025): Radar DataTree Demo on YouTube
At Earthmover, we believe this is just the beginning. Radar is one of the richest observational datasets in atmospheric science. With the right structure, it becomes a foundation for scalable research, operational tools, and machine learning at global scale.
When radar becomes a dataset, it stops being a burden—and starts powering science
References
- Ryzhkov, A., P. Zhang, H. Reeves, M. Kumjian, T. Tschallener, S. Trömel, and C. Simmer, 2016: Quasi-Vertical Profiles—A New Way to Look at Polarimetric Radar Data. J. Atmos. Oceanic Technol., 33, 551–562, https://doi.org/10.1175/JTECH-D-15-0020.1.
- Marshall, J. S., and W. M. K. Palmer, 1948: THE DISTRIBUTION OF RAINDROPS WITH SIZE. J. Atmos. Sci., 5, 165–166, doi.org/10.1175/1520-0469(1948)005<0165:TDORWS>2.0.CO;2.
Data Scientist